
Machine Learning Boosted PVT Solver
The main goal of this project is to develop a PVT solver specially for the case where a high percentage of CO2 is present in the mixture, capabale of handling 3-phase configurations (gas-CO2 liquid-liquid). Another important aspect of this project is to use machine learning techniques to enhance the fidelity of the results, using available experimental data.
The Predictive Peng-Robinson (PPR78) thermodynamic model, based on the Peng-Robinson (PR78) Equation of state (EoS), combined with the classical van der Walls mixing rules is widely used for the analisys of multiphase fluid equilibrium systems.
$$P = \frac{RT}{v -b_i} - \frac{a_i(T)}{v(v+b_i)+b_i(v-b_i)}$$The \(k_{ij}\) variable is know as the binary interaction parameter between the components and usually it is obtained from experimental data. For the The PPR78, \(k_{ij}\) is temperature dependent (\(k_{ij}(T)\)) and it can be evaluating directly. In the present project group interaction parameters are used.
$$k_{ij}(T)=\frac{-\displaystyle\frac{1}{2}\displaystyle\sum\limits_{i=1}^{N_g}\sum\limits_{j=1}^{N_g} (\alpha_{ik}-\alpha_{jk})(\alpha_{il}-\alpha_{jl})A_{kl}. \left(\frac{298.15}{T}\right)^{\left(\frac{B_{kl}}{A_{kl}}-1\right)}- \left(\frac{\sqrt{a_i(T)}}{b_i}-\frac{\sqrt{a_j(T)}}{b_j}\right)}{2\displaystyle\frac{\sqrt{a_i(T).a_j(T)}}{b_i.b_j}}$$Solution of these equations provides us the low fidelity data, which will be complemeted with high-fidelity experimental observations.
However, the results in Fig. 1 clearly show that the PPR78 method capture well the changing phases (from liquid-vapour to liquid) for a low concentration of \(CO_2\) in the mixture, while for a high values of \(CO_2\) in the mixture the model underestimate the pressure. It is known that adjusting the single binary interaction parameter between \(CO_2\) and \(CH_4\) (\(k_{( {CO_2-CH_4})}\)) improves the results. However, by adjusting this single parameter at each temperature, a slight agreement was observed at the experimental bubble points, while quite big discrepancies remained at the dew points. We improve the results (reducing the MSE) by employing a reasonable initial guess strategy and then find the optimal solution due to single evaluation task (grid search), which is the cost function minimizer.
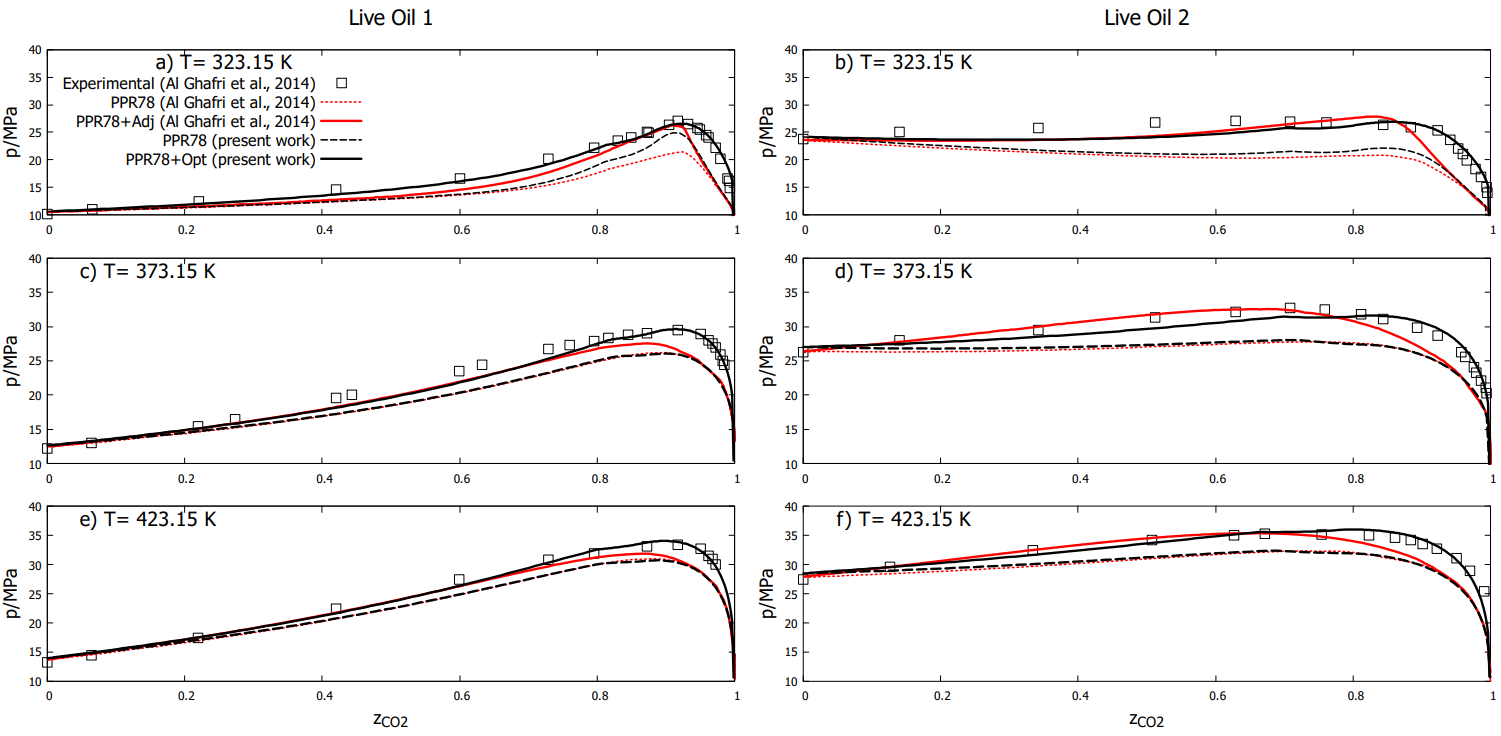 Figure 1. Bubble-point and dew-point pressures (\(p\)) as a function of the mole fraction (\(z_{CO_2}\) ) of \(CO_2\) for (\(CO_2\) + Live oil 1)
figures (a, c, e), and (\(CO_2\) + live oil 2) figures (b, d, e ): T = 323.15 K; , T = 373.15 K and , T = 423.15 K.
Figure 1. Bubble-point and dew-point pressures (\(p\)) as a function of the mole fraction (\(z_{CO_2}\) ) of \(CO_2\) for (\(CO_2\) + Live oil 1)
figures (a, c, e), and (\(CO_2\) + live oil 2) figures (b, d, e ): T = 323.15 K; , T = 373.15 K and , T = 423.15 K.